15 Marketing metrics to maintain & measure small business growth

When measuring your marketing activity, not all metrics are considered equal. If you focus on the wrong metrics to make strategic decisions, you may slow or even halt the growth of your business.
That’s not to say that you shouldn’t measure “vanity metrics”. These are still important indicators to measure marketing performance. But there’s a distinction between strategic metrics and indicators across channels, content and landing pages.
In this guide, we’ll explore various key metrics and segment them by each stage of the marketing funnel. You’ll learn what they are, how to use them and their importance within the marketing metrics.
Top Tip: Before you can measure the success of your marketing initiatives, you need to have a clear understanding of your target audience and how to build a brand that they love. This includes defining your unique selling proposition (USP) so that you can stand out from the crowd and engage in meaningful interactions with your potential customers. Most importantly, you should know all of this before you launch your product or service. To learn more, read our 5-step guide to building an effect go to market (GTM) strategy 🚀
Table of Contents
- Your “True North” marketing metrics
- Metrics for Awareness
- Metrics for Consideration
- Metrics for Retention
- Expert insights
- Wrapping up
Your “True North” marketing metrics
True north metrics are considered the most important when measuring your marketing performance. These are the important metrics that inform whether your growth initiatives are contributing to your core business goals.
Most of these might seem obvious to you. But they’re well worth mentioning, as it can be easy to get distracted. Especially as you experiment with new channels and different forms of content.
1. Revenue
Revenue is probably the most critical metric for measuring how well your marketing is performing.
Why? Because at the end of the day, a marketing campaign could generate thousands of visits to your website or likes on an Instagram post. But if it’s not generating revenue, there’s something going wrong.
Measuring your marketing by revenue gives you a truly objective view on performance. You can justify investment in a particular channel if it’s contributing to cash flow and overall growth.
Top Tip: Monitoring your cash flow helps you understand how well your business is performing on the whole. It also gives you a picture into exactly how much money is coming in and going out of your business at any given time. As many new businesses fail due to running out of cash, understanding how to properly track your cash flow is key to your survival and growth. To learn more, read our complete guide to accounting for startups 📌
2. Customer lifetime value (CLTV)
Along with initial revenue, understanding the lifetime value of your customers is also invaluable. When you understand your average CLTV, you can calculate the true ROI of your marketing efforts.
Typically, CLTV is calculated by how much a customer spends with you on average each time they buy, how often they buy and how long they’re a customer. Here’s a step-by-step process to calculate this:
- First, calculate your average purchase value by dividing the total amount of revenue over a year by the number of purchases over that same period
- Then, calculate average purchase frequency rate by dividing the number of purchases above by the number of individual customers who purchased
- Next, calculate customer value by multiplying the average purchase value (see step 1) by the average purchase frequency rate (see step 2)
- Now, calculate your average customer lifespan, which is simply the average number of years a customer does business with you
- Finally, calculate CLTV by multiplying customer value (see step 3) by average customer lifespan (see step 4).
Let’s run through an example with Business A.
Business A’s stats in a year:
Revenue: £100,000
Purchases: 2,000
Number of individual customers who purchased: 50
- Average purchase value: £100,000 / 2,000 = £50
- Average purchase frequency rate: 2,000 / 50 = 40
- Customer value: £50 x 40 = £2,000
- Average customer lifespan: 2.5
- CLTV: £2,000 x 2.5 = £5,000
You should now have an estimate of the average amount of value a customer brings over time.
3. Customer acquisition cost (CAC)
Tracking your marketing costs is far easier these days, thanks to the shift from “spray and pray advertising” to digital channels. By calculating how much it costs to acquire a customer, you can make better strategic decisions for your marketing.
Top Tip: A comprehensive digital marketing plan is key if you want to meaningfully connect and engage your target audience online. To learn more about how to achieve your core digital business objectives, as well as the core digital marketing channels you should consider marketing on, read our guide to how to create a complete digital marketing strategy for your small business💡
To calculate CAC, simply divide the amount spent on a marketing channel or campaign by the number of customers acquired. For example, if you spent £10,000 on Facebook Ads and generated 2,000 customers as a result, your CAC would be £5.
CAC can often seem like a daunting number, especially if margins are thin. Which is why it’s important to calculate and optimise your CLTV. We’ll cover this in more detail when we talk about ROI.
4. Cost per lead (CPL)
As well as CAC, it’s also important to calculate your cost per lead. And just like CAC, this is calculated by dividing the amount spent on a marketing initiative by the number of leads generated.
This, along with CAC, is useful for several reasons. First, it will determine if you’re generating leads at a sustainable rate. And secondly, it will allow you to focus on optimising various stages of the funnel to reduce your cost per lead while increasing conversions.
Let’s use Facebook Ads again as an example. If you spend that £10,000 on ads and generate 5,000 leads, that would mean you have a cost per lead of £2.
If you wanted to reduce your cost per lead, you could try a couple of things:
- Reduce the cost-per-click (CPC) of your Facebook ads by making your copy and creative more relevant
- Improve elements on your landing pages to increase conversion rates
This is how you use these critical metrics to improve marketing performance.
Top Tip: Facebook is just one of the many social media channels that you can use to generate paid and organic traffic. To learn more about how to use social platforms to your advantage, read our 7-step guide to creating a social media marketing strategy for your small business 📱
5. Marketing return on investment (MROI)
Finally, there’s your marketing return on investment. This can be calculated one of two ways:
- Dividing the amount spent on marketing (overall and across specific channels) by revenue generated
- Dividing the amount spent on marketing by CLTV
The first gives you a true, objective view of your marketing. It shows you how much cold hard cash you’ve earned from your marketing efforts. However, it’s still wise to calculate against CLTV to help project future revenue and justify your marketing investment.
Metrics for Awareness
Measuring your results at the awareness stage is critical to understand the reach of your marketing message. It’s a good indicator of brand awareness and volume at the very top of the funnel.
Here, we’ll cover the core metrics and areas of your marketing you should be measuring at this phase.
1. Website traffic
How much traffic are you generating to your website on a weekly or monthly basis? By getting a birds-eye view of the visitors to your website, you’ll generate insights on seasonality, trends and your top-performing channels or content.
This data can all be acquired through web analytics tools, and there are several on the market. Google Analytics is the most well known, free and easy to use option. There’s also Statcounter, GoSquared, Matomo, and many more. Take a look at your options, research them, and choose one that fits best with your business goals.
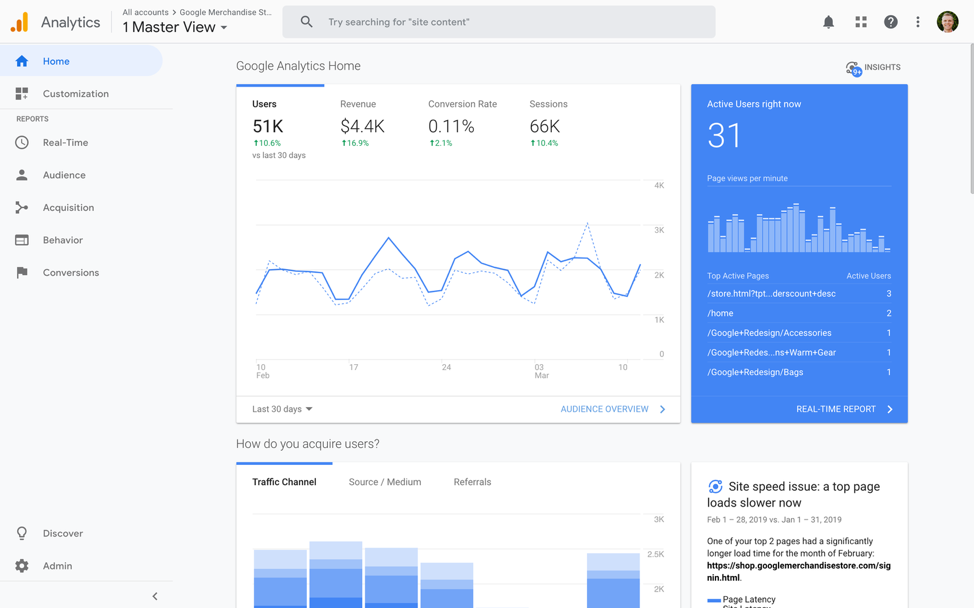
Let’s start with overall traffic. Check out how many visitors you generated over the course of a year. Were there any spikes or drops across a certain month? Looking for these patterns can make you aware of seasonality trends, and plan accordingly for the following year.
You must also keep an eye on traffic across each marketing channel. These channels are usually segmented into the following categories:
- Direct. Traditionally, this means people who visit your website by entering your URL straight into their browser. These days, it also counts for traffic that cannot be attributed (in other words, if the source of traffic to your site is unknown, it will be attributed as direct traffic).
- Referral. This is traffic that came from another website e.g. a link from another domain.
- Organic Search. These are visitors that found you through the organic search engine results pages i.e. they entered a keyword and clicked-through to your website.
- Social. Traffic that comes from social media platforms, such as Twitter, Facebook and LinkedIn.
- Paid Search. Similar to organic search, this is traffic that comes from your pay-per-click (PPC) campaigns.
- Email. This includes any traffic that you generate from your email marketing campaigns.
Use traffic to measure your top-of-funnel and awareness performance. This way, you can determine which channels to invest in to increase volume.
2. Social media reach
The reach of your social media content is a great indicator of your branding efforts. Businesses have two options with social reach efforts: organic and paid.
Organic is free and comprised of engaging content that enhances your overall brand image and experience. With organic, it’s important to show customers your personality. Best practice is to be transparent while professional, respond to comments, follow hashtags and be relatable. This is your opportunity to connect with customers on a human level; which leads to trust and eventually loyalty.
Paid, on the other hand, is a chance to extend your reach through targeted ads or campaigns. Use these tools to boost awareness, generate leads, drive traffic to your site and offer promotions with improved visibility.
Social media reach also acts as an indicator of the distribution and coverage that your content is getting across your chosen social media platforms.
This is usually presented as the number of shares your content has generated, and can be uncovered in a number of ways. For example, on Facebook, you’ll see how many people saw a post from your business page:

You can also use tools like BuzzSumo or Ahrefs to evaluate reach. Simply enter your domain into their Content Analyzer, and you’ll see your most shared pages and content by channel:
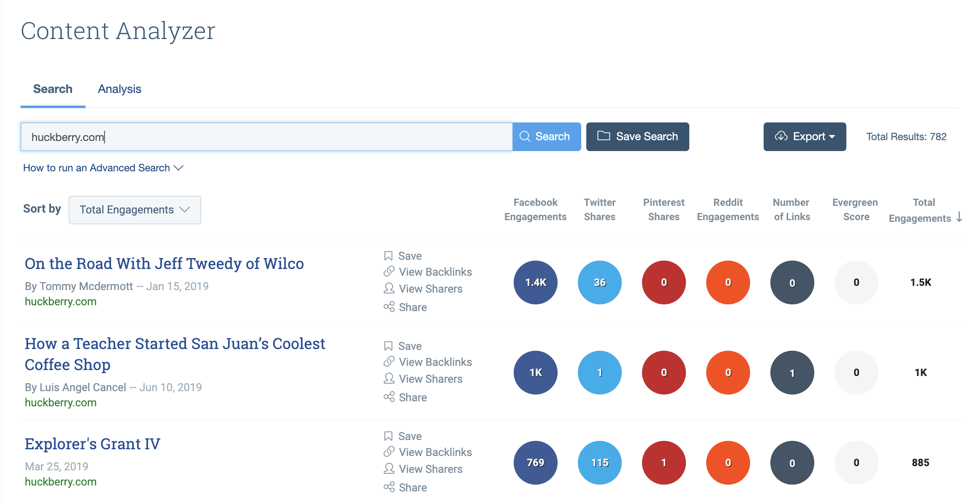
Segment this data by social platform to see which are performing well. Couple this with traffic metrics to get a clear view on your top-performing channels and content. You can also get ideas from your competitor’s top-performing content by plugging in their site and reviewing their stats.
Top Tip: Speaking of competitors, it’s important to keep a pulse on your target market in order to see how the landscape evolves over time. This way, you can stay on top of where your customers hang out online (or in person), what your competitors are up to and how they’re positioning their solutions, and where the industry is headed. Market research should be conducted before you launch, but it’s also an ongoing process that you should revisit often to ensure you never miss a beat. To learn more, read our guide to how to conduct market research for your business idea ⚡️
3. Brand mentions & searches
Seeing how often you’re mentioned online is another great way to measure awareness. There are several ways to do this.
First, there’s monitoring how many people mention you within their content online. This can easily be done with a tool like Google Alerts, which will give you a daily or weekly digest of sites that have mentioned you online:

Alternatively, you can use a tool with more in-depth functionality like Mention. These tools usually contain more advanced features, such as monitoring social media mentions in real-time (as well as the ability to respond to them directly from the platform):

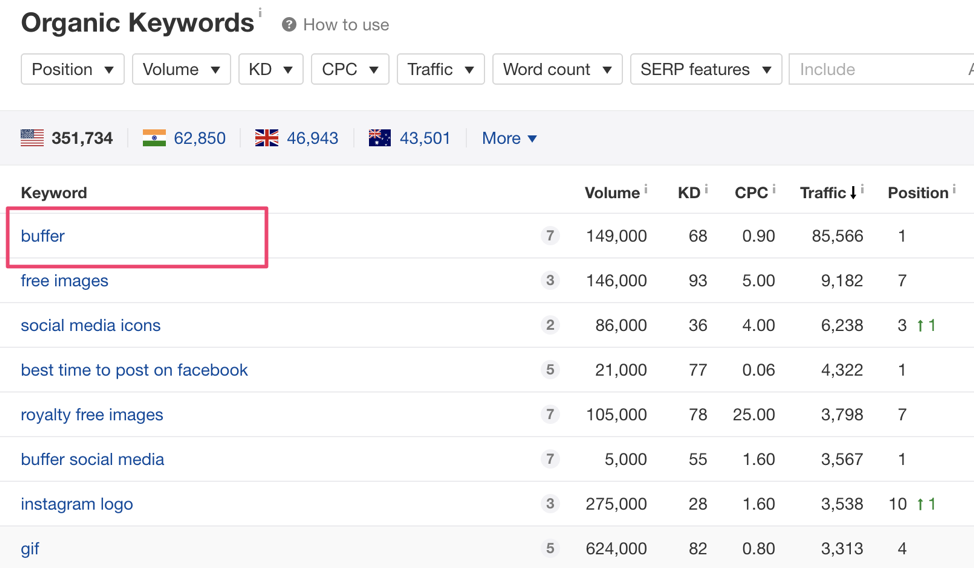
You should also monitor how many branded visitors and impressions you’re generating from search engines. Use Google Search Console to keep track of how many people are searching for your brand directly. Below is an example for Buffer’s brand search volume using the tool Ahrefs.
4. Engagement metrics
The content on your site can be consumed at all stages of the marketing funnel.
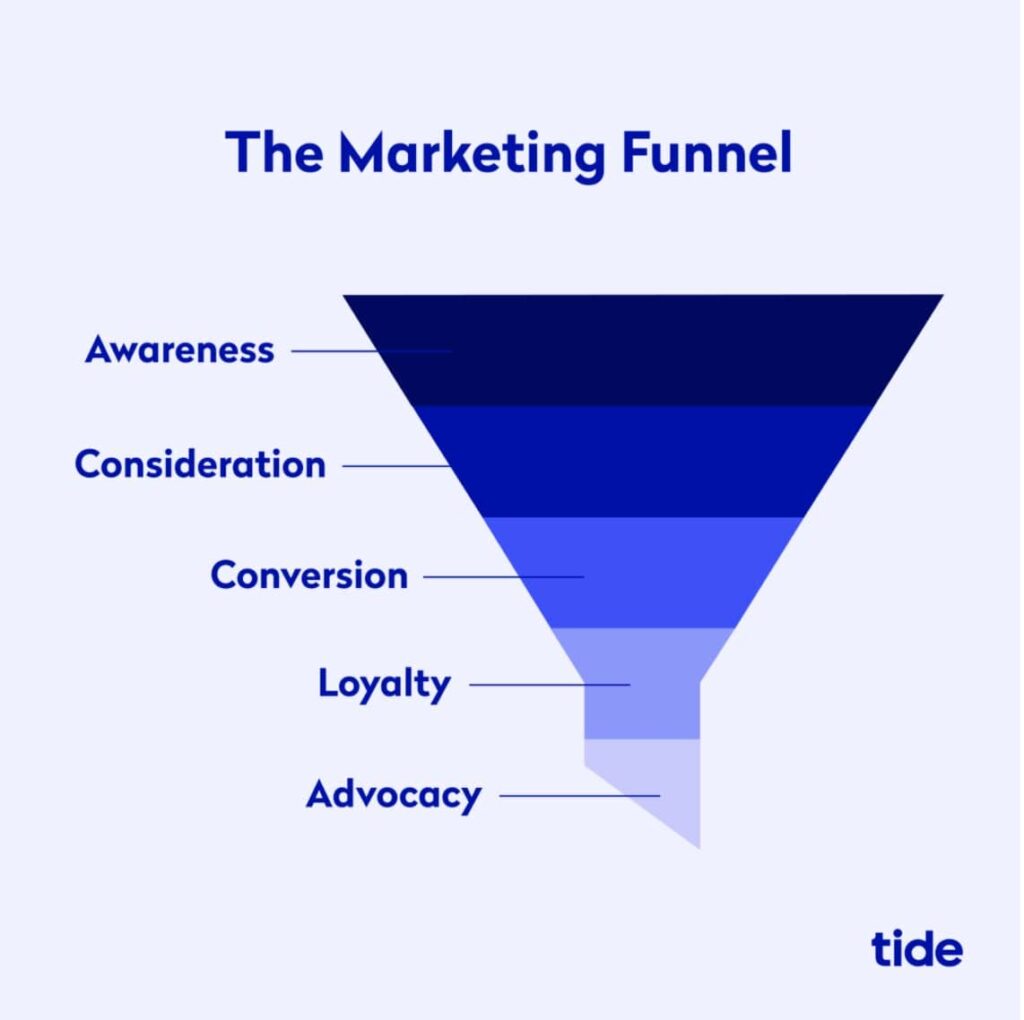
However, it’s important to measure engagement metrics to figure out how visitors are interacting with it.
Two of the most common engagement metrics include:
- Average time on site/page. This is the amount of time visitors spend on your website overall, or a specific page.
- Bounce rate. The percentage of visitors who visit a page without navigating to another one. In other words, the rate of those who visit your site and “bounce” without taking another action.
You can also use tools like CrazyEgg and Sumo to analyse how people interact with the various elements on your landing pages and content. Here’s how heatmaps appear in CrazyEgg:

With this insight at hand, you can make improvements to your pages to increase time on site, and even conversions.
Metrics for Consideration
At the awareness stage, we covered broad metrics and marketing analytics that indicate how well your message is being spread, and how you engage with visitors.
Now, let’s look at how well individual elements of your marketing are contributing to the lead generation and conversion.
1. Visits & conversions by source
At the consideration phase, the focus is on guiding prospects through your funnel with the end goal of generating conversions. To measure the conversion rate at each stage of a customer journey, we need a holistic view for each channel and source.
Start by going back and looking at the number of visitors you generate to your website. Don’t just look at this from a channel-level view (e.g. “organic search”). Get deep into the individual referring websites and social platforms that generate a high volume of traffic and conversions.
In Google Analytics, you can do this by heading to Acquisition > All Traffic > Source/Medium:

Then, use Goals to measure conversions and conversion rate by each channel. Not sure how to do this? Monster Insights has an easy-to-follow guide you can check out here.
2. Landing page performance
Break down the number of visitors you’re generating for your website overall vs. your landing pages. A landing page is a standalone page usually used for advertising or marketing purposes to promote a specific product, feature, deal, campaign, or item. It’s the page a visitor lands on after clicking a hyperlink. This can also be your home page.
Keep a keen eye on landing page traffic, as these are the pages that contribute to specific results and yield an action from your prospects.
Make sure you monitor the following metrics:
- Total landing page visits. How many visitors are you generating to your landing pages? Measure this for each of your pages to segment them by performance
- Traffic source. Which sources, referring pages and ad campaigns are generating traffic to your landing pages?
- Total conversions. How many conversions are you generating across each landing page?
- Conversion rate. What’s the conversion rate (e.g. the percentage of visitors who take action) for each landing page? Go deeper and segment these by channel and campaign
These metrics will allow you to make granular decisions across your campaigns and the journey to a specific conversion. For example, if you see an important landing page has a lower conversion rate than others, you can prioritise this for your conversion rate optimisation (CRO) efforts.
4. Call-to-action (CTA) performance
This is one of the most effective metrics you can measure throughout the consideration phase. Look at how many visitors are actually clicking on your CTAs. This can be further segmented into two buckets:
- Navigational CTAs. These are the CTAs that drive a visitor to the next stage of your funnel e.g. clicking an ad which takes them to a landing page.
- Conversion CTAs. These will be found on your landing pages, and usually involve filling out and submitting a form.
Measure the click-through rate (CTR) of your CTAs and look for optimisation opportunities. For example, how does a change in colour or copy affect conversion rates? Make small tweaks, split test and see how these changes improve performance.
Metrics for Retention
With all these metrics on acquisition and conversions, it can be easy to forget about your existing customers.
Here, we’ll cover three critical metrics to measure customer retention, loyalty and satisfaction. These will help you focus on generating more revenue from the customers you’ve already attracted and captured.
1. Customer churn
Customer churn is the rate that customers stop buying from or subscribing with you. For subscription-based businesses (such as SaaS) this is critical, as reducing churn means more predictable revenue.
Depending on your business, churn can happen for several reasons:
- A customer ending a subscription they have with you
- They’re no longer using your services, or
- They’ve stopped buying your products
How you calculate churn will depend on the size of your business. For example, if you have tens of thousands of customers, you may want to calculate churn on a monthly basis.
To calculate churn, subtract the number of customers you had at the start of a period from the number of customers at the end of that period (e.g. 1st March to 31st March). Then, take that number and divide it by the number of customers at the start of the period.
For example, if we had 500 existing customers on 1st March and 480 on 31st march, that means 20 customers churned, giving us a churn rate of 4%.
2. Existing customer revenue growth rate
This metric is critical for measuring retention. If existing customers are spending more with you, this means your marketing and sales are successfully encouraging customers to buy from you more frequently (or upgrade their plans).
Most importantly, it means your customers truly see the value your products or services deliver. However, if this rate is dropping, it should be a huge red flag that needs addressing ASAP.
Customer revenue growth rate must only take into account the revenue generated from existing customers – not new customers.
To calculate this, subtract the revenue or monthly recurring revenue (MRR) from the end of a specific month and subtract it from the revenue or MRR from the beginning of the month. Then, divide that result by revenue or MRR at the start of the month.
For example, let’s say your MRR from existing customers was £2,300 on 1st March and £2,750 on 31st March. This means your existing customer growth rate is 19.56%!
3. Net promoter score (NPS)
NPS is a metric that measures how satisfied and loyal your customers are with your brand. Rated on a scale of 1-10, it can be a strong indicator of how likely a customer is to recommend your products or services.
The scoring can be positive or negative and ranges from -100 to +100. Naturally, if you have more negative than positive responses, the range will dip towards the lower end.
Don’t be surprised if your score is lower than you imagined. Statistics show that people who undergo negative experiences are more likely to report them than those who have positive ones. This is reflected in an industry benchmark report published by Hubspot.
Calculating NPS is simple: ask your customers, on a scale of 1-10, “How likely are you to recommend our company to a friend or colleague?”. Here’s how to use this score to segment your customers:
- Customers who score below a 6 are known as detractors, and are considered unhappy customers who may hurt your brand
- Customers with a score of 7-8 are known as passives, and are considered unenthusiastic customers who may be enticed by competing offers
- Customers with a score of 9-10 are known as promoters, and are considered loyal customers who are likely to recommend your brand to friends and family
To calculate your NPS, simply subtract the percentage of promoters from the percentage of detractors.
Let’s say Business A surveys 500 customers. 300 responses are 9 or above, 150 responses are between 7 and 8 and 50 responses are 6 or below.
Percentage of detractors: 50/500 = 10%
Percentage of passives: 150/500 = 30%
Percentage of promoters: 300/500 = 60%
Business A’s NPS = 60% (promoters) – 10% (detractors) = 50
Net Promoter Score is always referred to as an integer and not a percentage, so business A’s NPS is 50.
💡 Expert insights
Start with the end goal
Insights author: Frances MacPherson is Senior Marketing Manager at DueDil, the company intelligence platform that helps businesses uncover risks and grow faster by delivering insights on more than 50 million companies and the people behind them.
To identify the right metrics to measure marketing performance, my first port of call is to look at the end goal. I always ask myself: 1) “what are we trying to accomplish with this activity or initiative?” and 2) “how is that tied to business outcomes?”, before defining the metrics we use to measure performance.
The metric will vary depending on marketing activity, channel and business goal. If we’re looking to boost brand awareness, for example, we’ll measure website traffic driven by campaigns and channel.
But if we’re looking to increase conversions, we’ll look at the number of leads generated and conversion rate by channel. We also track back from our revenue objectives to define our marketing targets each quarter to ensure we’re delivering the number of opportunities needed to hit our company revenue targets.
Choose the metrics that indicate success across your marketing channels
Insights author: Gordon Folta Global Digital Marketing Manager at Tom Dixon, a high-end furniture brand specialising in lighting and accessories.
Choosing the right metrics for your marketing activity is based on the channel you are focusing on, each channel requires a different set of metrics in order for you to identify optimisation opportunities, reinforce performance and have quantifiable measurements available for stakeholders to assess your work.
Using PPC activity as an example, metrics and key performance indicators (KPIs) should be chosen based on the defined aims and objectives pre-launch, one should always set targets. The metrics also depend on the marketing funnel; are you looking at top (awareness), mid (consideration) or lower (conversion) funnel campaigns.
For instance, if one is generating a campaign to drive brand awareness then impressions, sessions and clicks were a metric to consider. For a mid funnel campaign one might want to place special attention to sessions, bounce rate, add-to-basket and session time, and for lower funnel conversion-rate, revenue and average order value.
Each metric will allow you to assess whether a campaign is effective or not, the beauty of marketing is that it is all about testing and optimising in order to establish a formula that works (for a period of time until you have to adapt again).
Assessing these metrics will allow you to identify if your ad copy is meeting target standards to drive awareness, if the landing pages you are sending the audience resonates with their intent and whether your e-commerce has adequate UX and SEO standards to assist conversion.
Wrapping up
The marketing metrics laid out in this guide will help you direct your marketing efforts and measure overall performance. Remember, it’s key to keep an eye on your “true north” goals first and foremost. These indicate how well your marketing campaigns are contributing to your strategic business goals.
Then, measure the core metrics laid out here as indicators for each cog in your growth plan. From awareness to consideration to retention, it’s important you understand how each part of your funnel is performing.
And the benefits to all this? An ability to make core strategic decisions at every stage of the funnel.
Learn all about growing your business in our marketing series:
Marketing Strategy
1.1 How to create a ‘Go To Market Strategy’ to tap into new markets
1.2 A beginners guide to digital marketing strategy
1.3 How to run a competitive analysis
1.4 How to build a brand that customers love
Marketing Ideas
2.1 8 affordable in-depth marketing ideas to grow your small business
2.2 30 ways to get clients as a freelancer
2.3 5 marketing metrics to maintain & measure small business growth
Marketing Channels
3.1 How to create a social media marketing strategy in 2020
3.2 The small business guide to Instagram marketing
3.3 How to build brand loyalty with relationship marketing
3.4 How to master business storytelling
3.5 How to grow your business with video (on a budget)
Photo by Burst, published on Pexels
Become a Marketing Pro with our guide
As a small business owner, it can be tough getting new customers without breaking the bank.
Download our small business guide to marketing on a budget and learn how to acquire customers and build your business from £0 a month.


